How data visualization helps to plan and evaluate the campaign approach
For more than two-thousand years, maps have been used to try to help us make understand the world. As we tried to make sense of the range of campaign activities that made up the Scaling Improved Legumes Technologies (SILT) project in Tanzania, our project partners at Farm Radio (FRI) suggested we produce a map.
These maps went live this week.

Tanzania Improved Legume Technology campaign maps
Tanzania 2016-2018 multiple media campaigns on common bean, soybean, potato, cassava and maize campaign maps
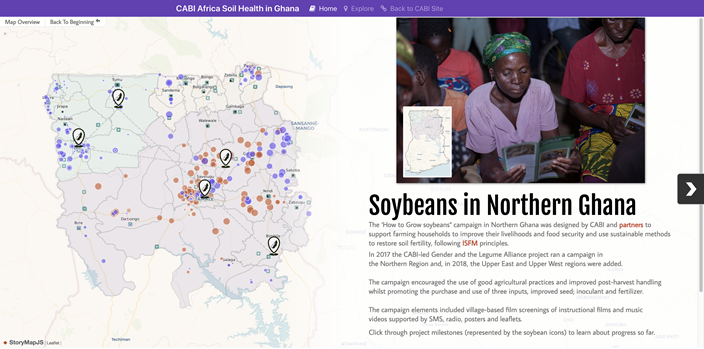
Ghana 2017 and 2018 village-based film screening soybean campaign maps
FRI’s Mark Leclair explained: “FRI had started to work with mapping specialists Thad Kerosky and Sierra Ramirez on what are known as story maps. These maps allowed us to plot out the main aspects of the campaign such as the areas covered by the participating radio stations and physical points of data such as the location of the demo plots or Shujaaz comic distribution points. The cool thing about these maps is that we can build up pages of narrative that tell the story of the campaign. However, the maps have some levels of interactivity to allow people to drill down to the areas or information that interests them.”
The maps are a valuable resource for recording the complex relationships we have with different communities – to show how the multiple campaign elements have been built up in different locations. For example, someone in Babati district in Tanzania could encounter a comic in which the benefits of bean cultivation are discussed, hear some advice about best practices in a radio show, and visit a demonstration plot to learn more in person. Being able to visualise these interventions means that focused evaluation can more easily take place. It is possible to explore the places where different combinations of media have been available to farmers and see how uptake of technologies has varied with the different levels of exposure.
In addition, the maps can help further campaign planning by showing how different communities have been sensitized.
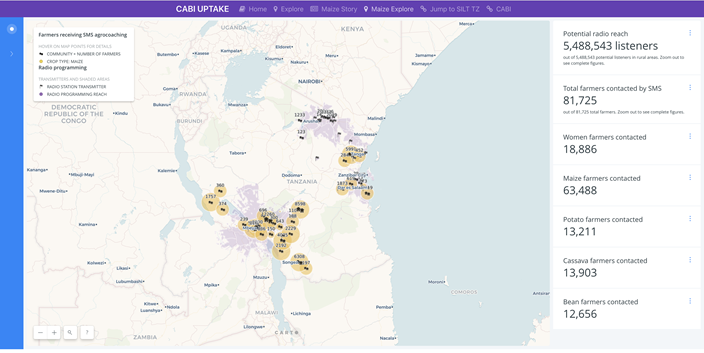
Inspired by the maps from the SILT, CABI has started to develop maps that reflect the different country campaign plans developed by the Africa Soil Health Consortium (ASHC) projects. This has included a second campaign in Tanzania, also developed with Farm Radio, known as Upscaling Technologies in Agriculture through Knowledge and Extension (UPTAKE).
Stephanie Gakuo, from CABI explains: “The UPTAKE project was exploring how digital media, especially radio and SMS, worked together to share agronomic information with farmers. We worked on a variety of crops including potatoes, maize, beans and cassava. At a glance, the maps tell the UPTAKE story of how the campaigns built up, whom we reached and where. Stakeholders can straight away cut to the project’s focal areas, view the story and tell where the project had greatest effect.”
CABI has also produced maps for the campaigns in Northern Ghana. Over two years some 300 village-based film screening have reached around 70,000 members of farming households with information on soybean farming and, in 2018, fall army worm was added to the screenings.
CABI’s James Watiti explains: “In Ghana we are building up a lot of data about the village-based screenings and other key data, like the location of agro-dealerships. This will make it easy for us to think about the next steps in the soybean campaign as we explore options with different partners. They will also be shared publicly so that others are aware of the sensitization we have been carrying out with legume farmers and in relation to fall armyworm. A comprehensive effort to map campaign activity in this way could help to provide better information services to farmers.
In Tanzania, he idea of an alliance of organisations interested in legumes is more developed. We shared resources and intelligence with other organizations to maximize the coverage of our target areas with information based on the same technology brief. This has led to some interesting results about how the campaign approach works for agronomy with different members of households being targeted through different media: it does seem that confidence rises in the technologies and more households are willing to try out the new technologies. The maps help us to make sense of the relationships between the different elements of the campaign.”
Further information about the campaigns can be found at www.africasoilhealth.cabi.org
The GALA project is funded by the UK Department for International Development and supported through the Sustainable Agricultural Intensification Research and Learning in Africa (SAIRLA) programme